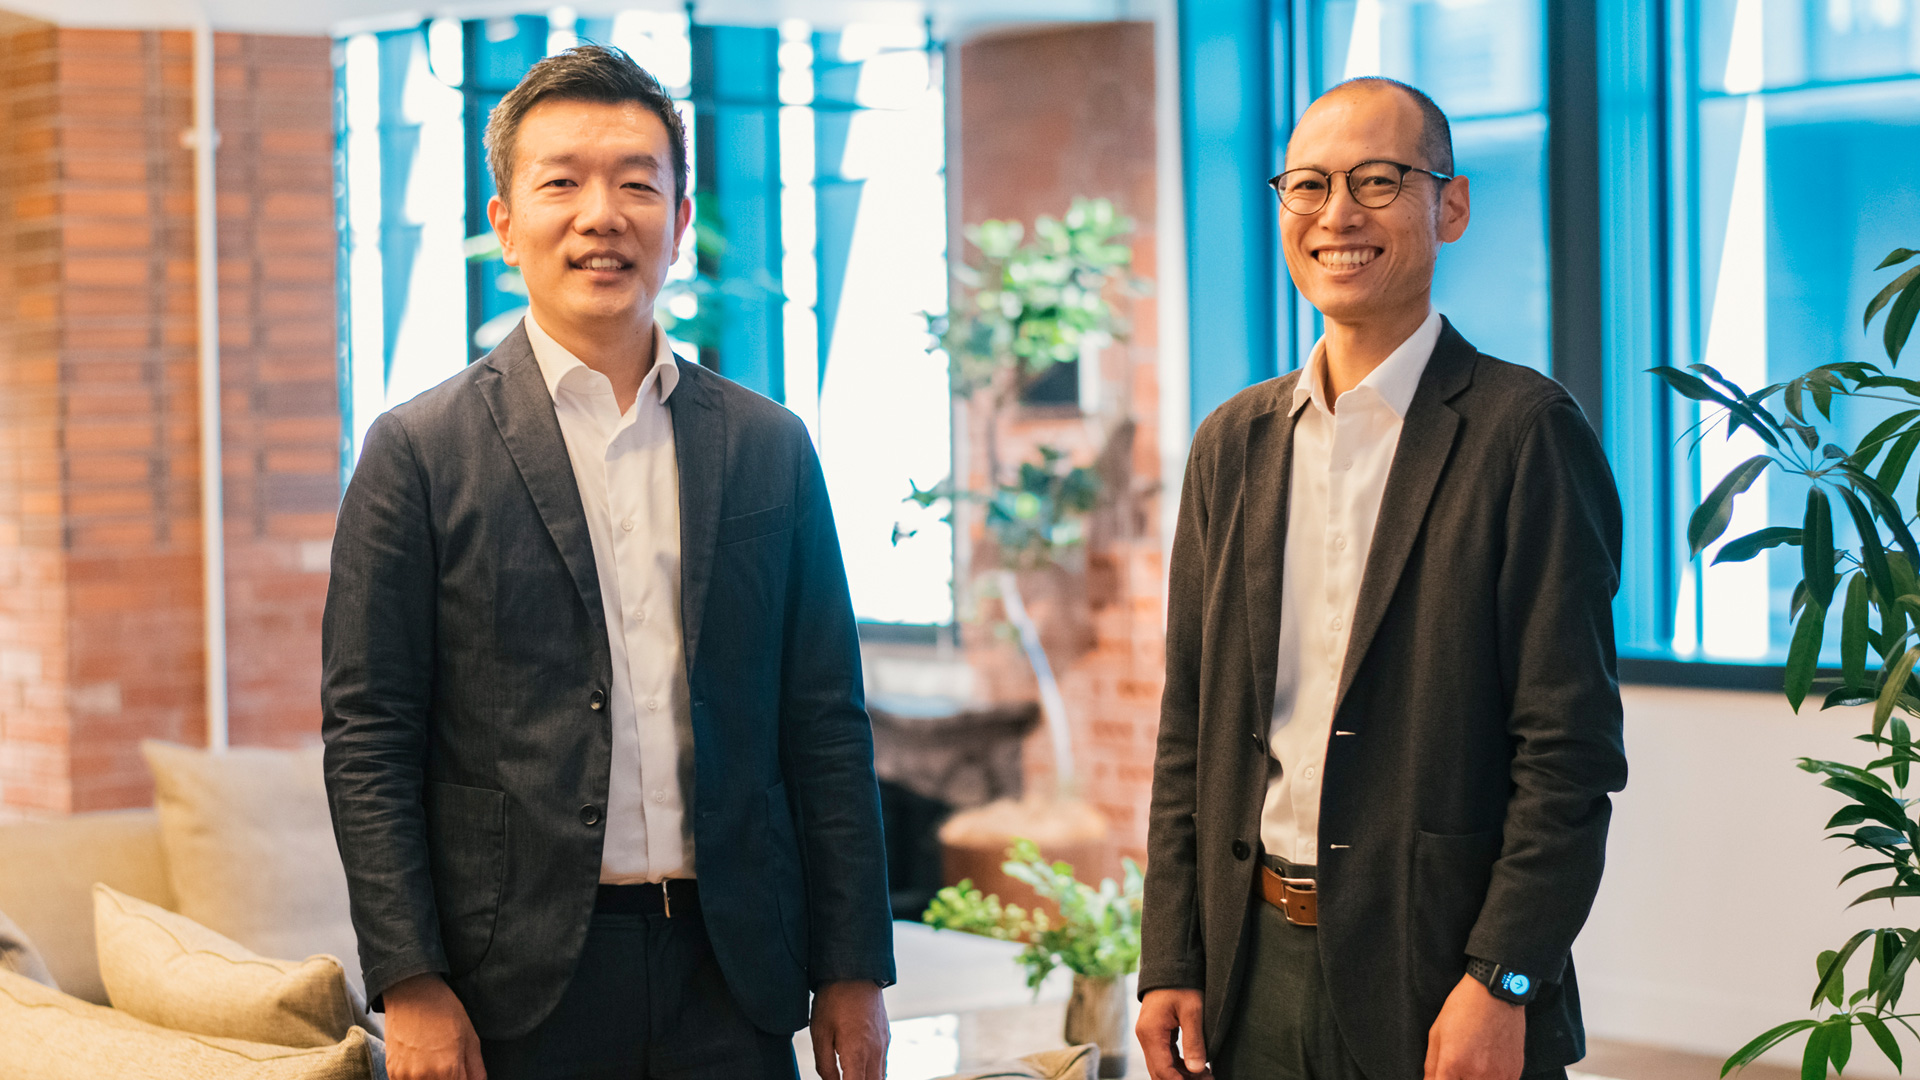
The "Shibuya Data Consortium" combines data from industry, government, academia, and citizens to build a solution creation platform for solving social issues in Shibuya City. This time, we asked two people from Takenaka Corporation, who are members of the consortium and also a member company of Future Design Shibuya, about their thoughts and visions in their activities.
To support the lifestyle and culture of Shibuya with digital technology
——While you have been involved in various advanced initiatives before joining the Shibuya Data Consortium, there is a project called “Sotocomi” that is deeply related to Shibuya, right?
AndoYes. For example, the weather is very nice today, but when you're inside a building like this, it's hard to know how comfortable it is outside. "Sotocomi" means that we put sensors on the rooftops of buildings and public spaces so that people inside the building can understand the thermal comfort of people outdoors. By displaying something like a comfort index on smartphones and signage, it is a system that encourages people to go outdoors.
For example, when the common space of an apartment complex is on the rooftop, the comfort of the rooftop can be seen on the monitors in each unit to guide residents to the rooftop. It is designed to guide customers by placing sensors on the three-dimensional streets and signage near the entrance on the first floor to indicate their comfort level.
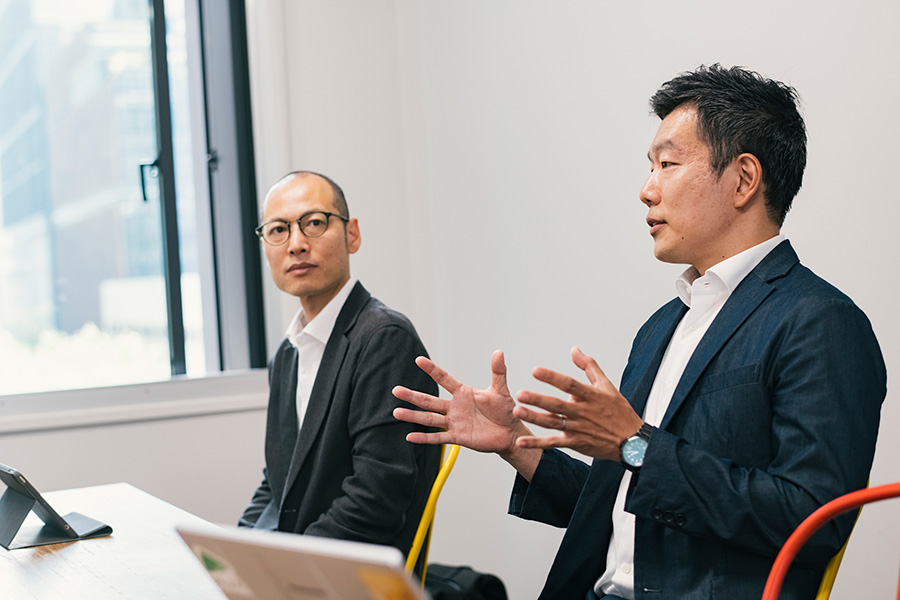
MorinagaWhile being involved in the development of Shibuya PARCO, we wanted to continue to be involved in urban development in Shibuya, which is why we have participated in Future Design Shibuya. For example, this "Sotocomi" is also implemented in Shibuya PARCO, but it is not a single building, but it is expanded a little at the town level. I also think that I can create an opportunity.
I find Shibuya very attractive in the sense that it is a city that respects diversity and is always a place where new things are born and challenges are created. Therefore, we decided to start doing what we want to do in Shibuya, so we also participated in the Shibuya Data Consortium.
AndoOur company had just launched an in-house project called “Urban Tech®,” which uses digital technology to promote the appeal of cities.
"Urban Tech" is a project that considers how we can contribute to the creation of attractive cities for end users by spreading our technology throughout the city. With the aim of proposing lifestyles, fostering attachment to the city, and creating new culture, we are proceeding with the development and implementation of "Sotocomi," which I introduced earlier, and "Social Heat Map®," which I will talk about later.

"Social Heat Map" Visualizing Community Emotions
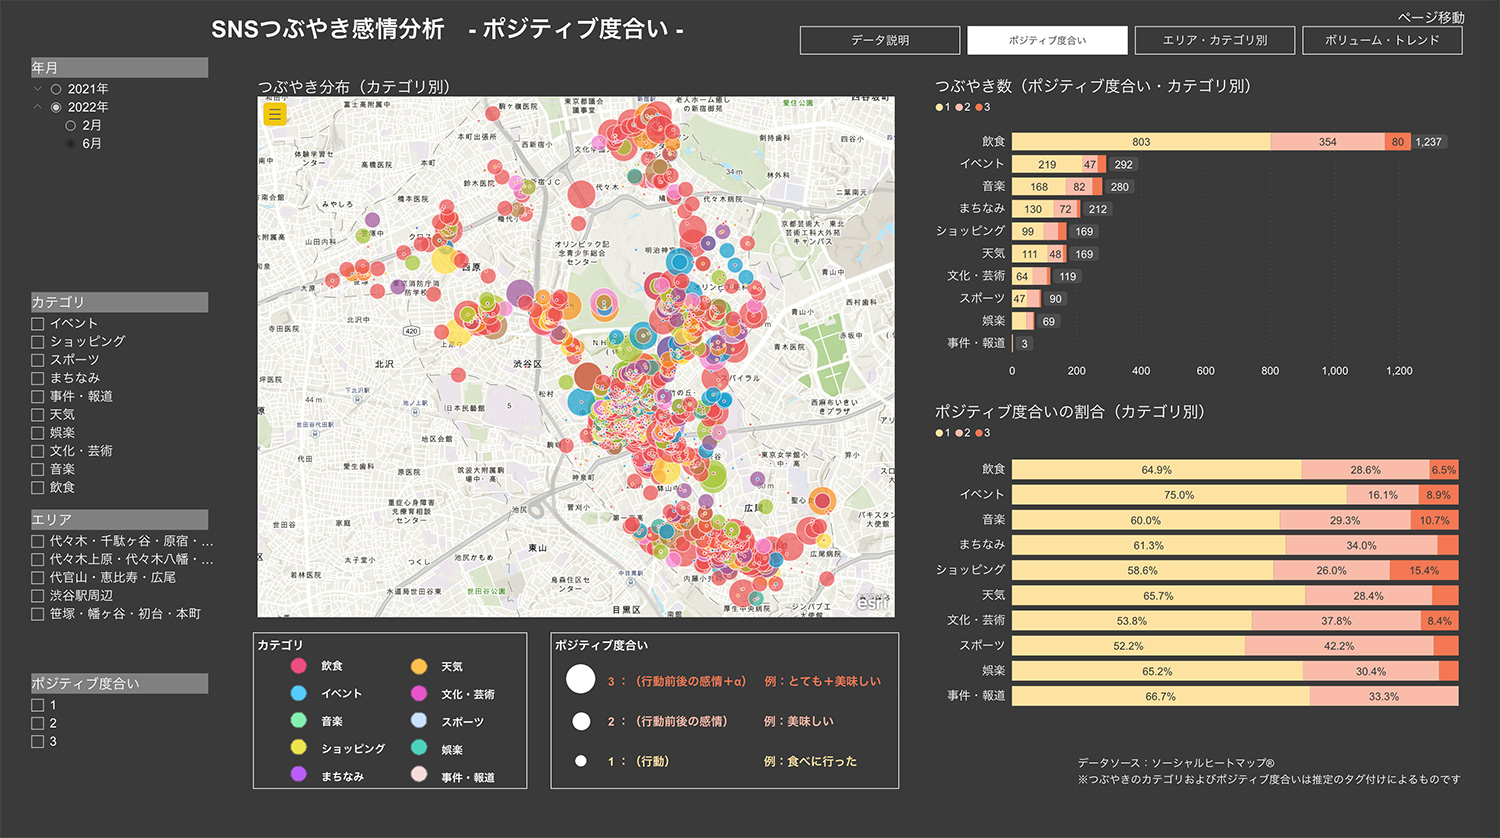
Ando"Social Heat Map" analyzes SNS data and extracts information related to people's emotions. From that data, it is a tool that visualizes what emotions are occurring in what places.
This has been adopted for Shibuya Ward's city dashboard (a platform that aggregates data from the ward and the private sector, visualizes it in graphs and maps, etc., and connects it to solving problems in the city).
▶︎City Dashboard|Characteristics of the city based on SNS tweets (social heat map)
2023"Social heat map" screen around the evening of June 2019
Many emotions related to eating and drinking are expressed as it is dinner time
AndoThe size of the bubble on the map indicates the emotional score of a person, and the color of the bubble indicates the difference between categories. For example, red is for food and drink, yellow is for shopping, and you can see where each emotion is moving in the city.
——The source of the previous “Sotocomi” is mainly sensor data from equipment installed in buildings that your company handled, but this “social heat map” is no longer your company’s building. So you're using data from unrelated sources as sources.
AndoThat 's right. Even without sensors, people tweet their thoughts about the city, and we analyze it to visualize what is happening in the city and how they feel.
MorinagaSo far, after building a building, our company was only able to get a vague sense of how people who came to the town felt about the place. By using it, you can now visualize your emotions.
——While this is a specific method of utilization for your company, it seems that there are more ways to utilize it by posting it on the city dashboard and linking it with data held by other companies. ,But it is that.
AndoIn fact, there was a tremendous response when it was posted on the city dashboard, and there have been several cases where people from other companies have said that they would like to co-create with Takenaka Corporation.
——How much positional accuracy can you see on this map?
Since it is Morinaga point data, it is possible to know with accuracy such as which building and which area.
——For example, in the area where there is a live house, it looks really lively at night.
AndoThat 's right. In terms of chronological order, I can see that the face of the city at night and in the morning is completely different, and I think that is one of the interesting things.
MorinagaAlso, we can visualize the difference in reaction to changes in the city, such as the large-scale development around Shibuya Station that is currently underway, before and after the development. In the future, we would like to explore ways to use time series to visualize changes not only in units of hours or days, but also in units of several years.
--It is interesting. The emotions of the city are being archived while having the two-dimensional spread on the map and the depth of time.
When it comes to data about Ando Town, I think most people tend to collect quantitative data that can be counted by number, such as the number of people, but we are analyzing qualitative data such as people's emotions. While appealing the uniqueness of the city through technology, we are trying to think about the attractiveness of the city by superimposing it on quantitative data.
Expectations for diverse corporate collaboration in Shibuya
--I see. Combining Takenaka Corporation's qualitative data with other companies' quantitative data also seems to provide hints for inter-company collaboration.
AndoThat 's right. There is also a case where we actually combined the data on the size of emotions in Shibuya with the data on how many people are or how few people are. However, in fact, areas with many positive emotions are also visualized.
MorinagaFor example, the so-called "Oku-Shibuya" area doesn't have as many people as around the station, but you can see that there are many positive tweets and a high level of satisfaction.
AndoThere are many things that cannot be seen from quantitative data such as whether there are many people or not. Depending on how you look at it, it can be perceived as an unpopular area because there are few people. However, I believe that by analyzing the emotions of people visiting the area, we can add another perspective to the findings obtained from quantitative data, and shed light on the attractiveness of the city. .
——Based on that, what kind of activities would you like to do through the Shibuya Data Consortium in the future?
AndoIn the future, we will continue to analyze and test the technology we have developed in the field of Shibuya, and we will have people from various companies participate in it. I would like to find a way to do that. We would like you to use our tools as an opportunity to think.
If any of the member companies of the Shibuya Data Consortium and Future Design Shibuya are interested, we would love to hear from you.
Text) Suke Amada
Photo) Masaru Saito


